Wounded Rainforest
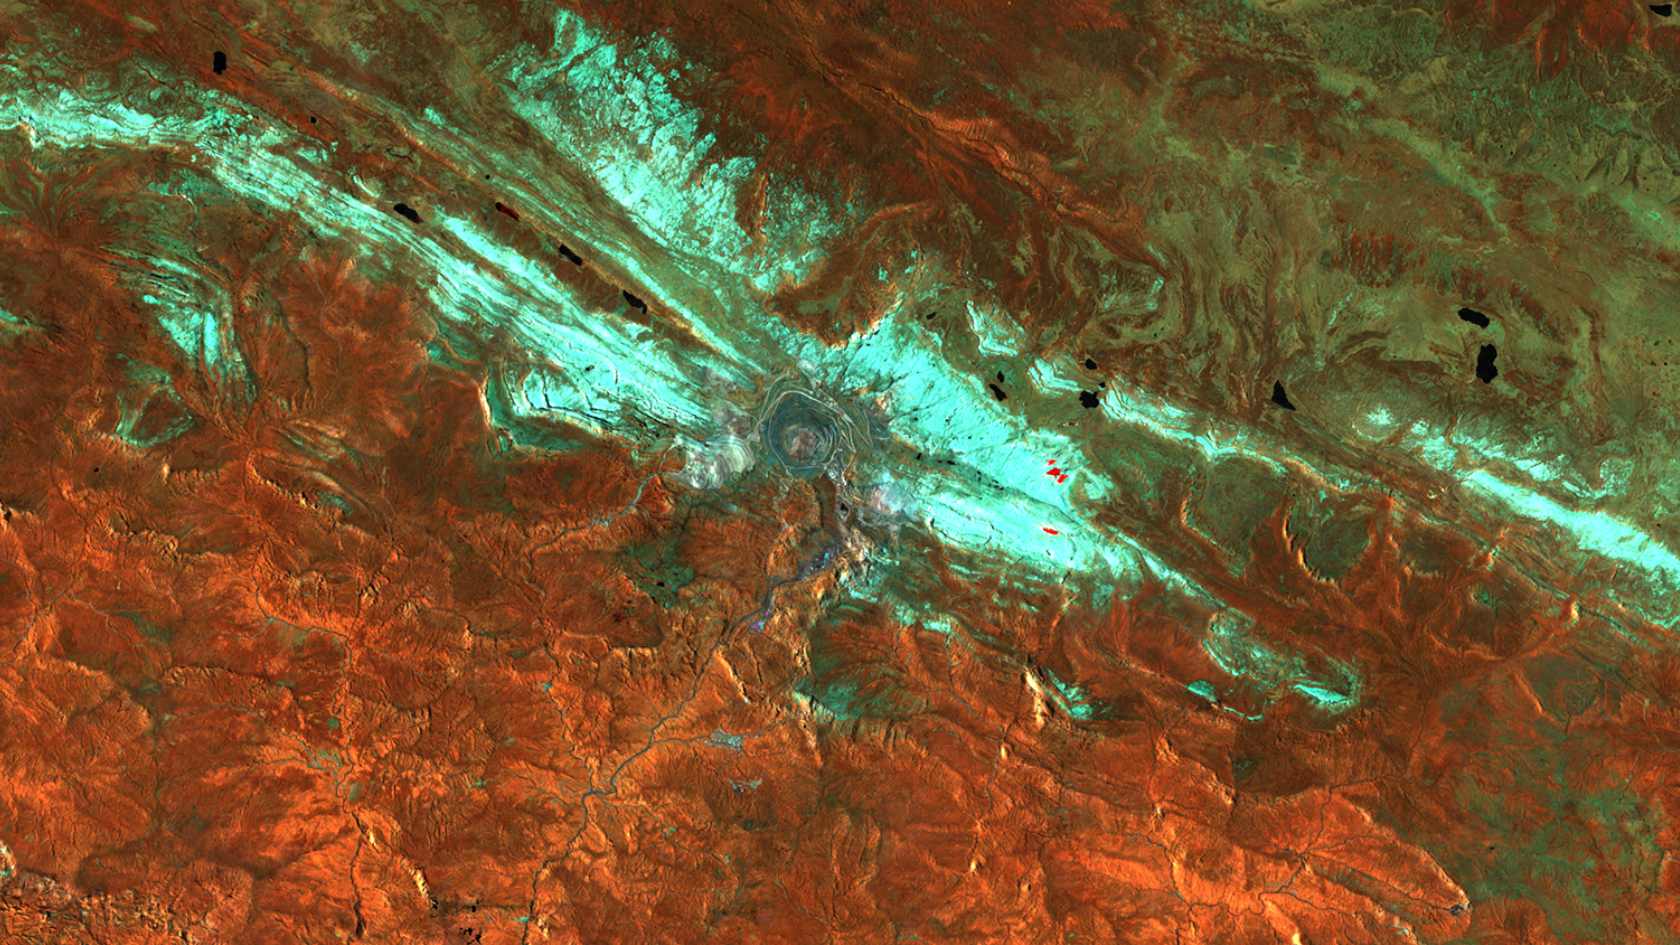
Up at the top of the mountain, there’s a huge wound: a crater that’s around two kilometers in diameter and several hundred meters deep. The Grasberg mine is one of the biggest and highest mines in the world. Gold, copper and silver are mined here, up in the remote mountains in the Indonesian province of Papua Tengah. Until 2019, this was done by open-cast mining, but since then the ores have been mined underground.
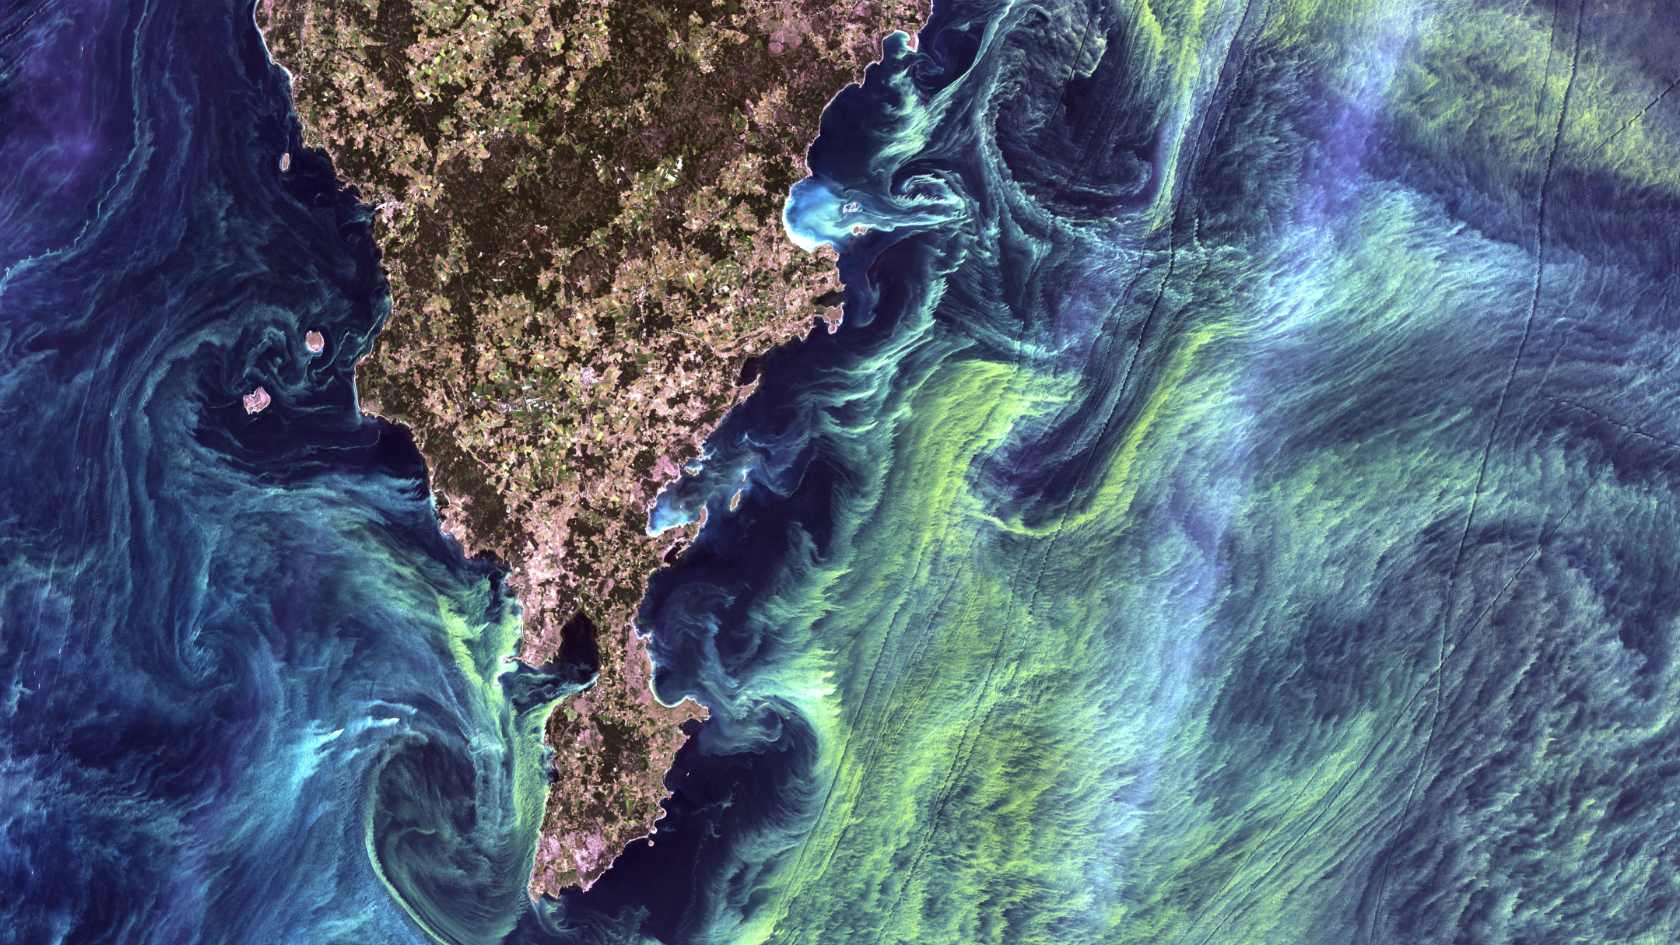
Papua Tengah on the island of New Guinea is one of the wettest regions in the world, with tropical rainforest covering the slopes all the way down to the Arafura Sea located some 100 kilometers away to the west of the Pacific Ocean. The crater of the mine is clearly visible on satellite images. The area to the south of the mine on the slopes of the Maoke mountain range glistens in varying shades of orange. The image is what is known as a false-color image. It depicts the near infrared spectral range, which our eyes can’t perceive, as Alexander Damm-Reiser, professor of remote sensing of water systems, explains.
The color represents the density of the vegetation. The richer the degree of orange, the denser the vegetation on the ground. But a dark wide scar runs right through the middle of this sea of orange. A broad strip of dark green and brown shades winds its way around 50 kilometers from the mine down to the delta of the Aikwa river: it’s the overburden from the mine contaminated with toxins. “It’s like an area of concrete,” says Damm-Reiser, “not much can grow here anymore because the natural ecological processes have been severely impacted.”
The images demonstrate vividly that the mining of ores at the mine is having a dramatic effect on the vegetation and water balance a great distance from the mine. The consequences can be felt over dozens of kilometers. When you look at the view from space, the link between the mine and the area of wasteland further down the river valley seems obvious. “Thanks to these images,” says Damm-Reiser, “we’re able to create a spatial context and look at the scale of environmental damage, for example.” How big is the effect? How does it vary depending on differences in altitude, or on the distance from the ocean?
Lack of data on biodiversity
This example of the Grasberg mine illustrates what the Spatial Sustainable Finance project is all about. Working with the finance professor Peter Schwendner and the geoinformatics professor Patrick Laube from ZHAW, along with Maria J. Santos and Leon Hauser from the Department of Geography at UZH, Damm-Reiser wants to establish methods in which satellite data can be used to document the condition of ecosystems within a certain radius of industrial plants or sites where raw materials are extracted. The aim is to provide investors with a science-based, independent way to evaluate the footprint that companies leave on water systems and biodiversity and incorporate it into their investment decisions.
Remote sensing allows an insight into ecosystems that just isn’t possible with the naked eye.
The project has just been awarded the Excellence in Environmental and Societal Impact certificate by the organization Geospatial World. This is because while it’s now established practice in light of climate change for companies to disclose their greenhouse gas emissions and other climate-relevant factors, corresponding data on biodiversity or water quality is still largely lacking.
Images from space may offer one way to compensate for this shortcoming. “Remote sensing allows an insight into ecosystems that just isn’t possible with the naked eye,” says Damm-Reiser. Different areas of the electromagnetic spectrum can be measured using optical sensors, thermal sensors, and radar or microwave sensors. “These different wavelengths each interact differently with the atmosphere and the surface and include corresponding complementary information,” says Damm-Reiser.
Depending on the wavelength, Damm-Reiser can use these measurements to deduce information about surface quality, moisture, temperature, color or other factors. They all serve as indicators of conditions or processes that take place at the observed locations.
Overview from space
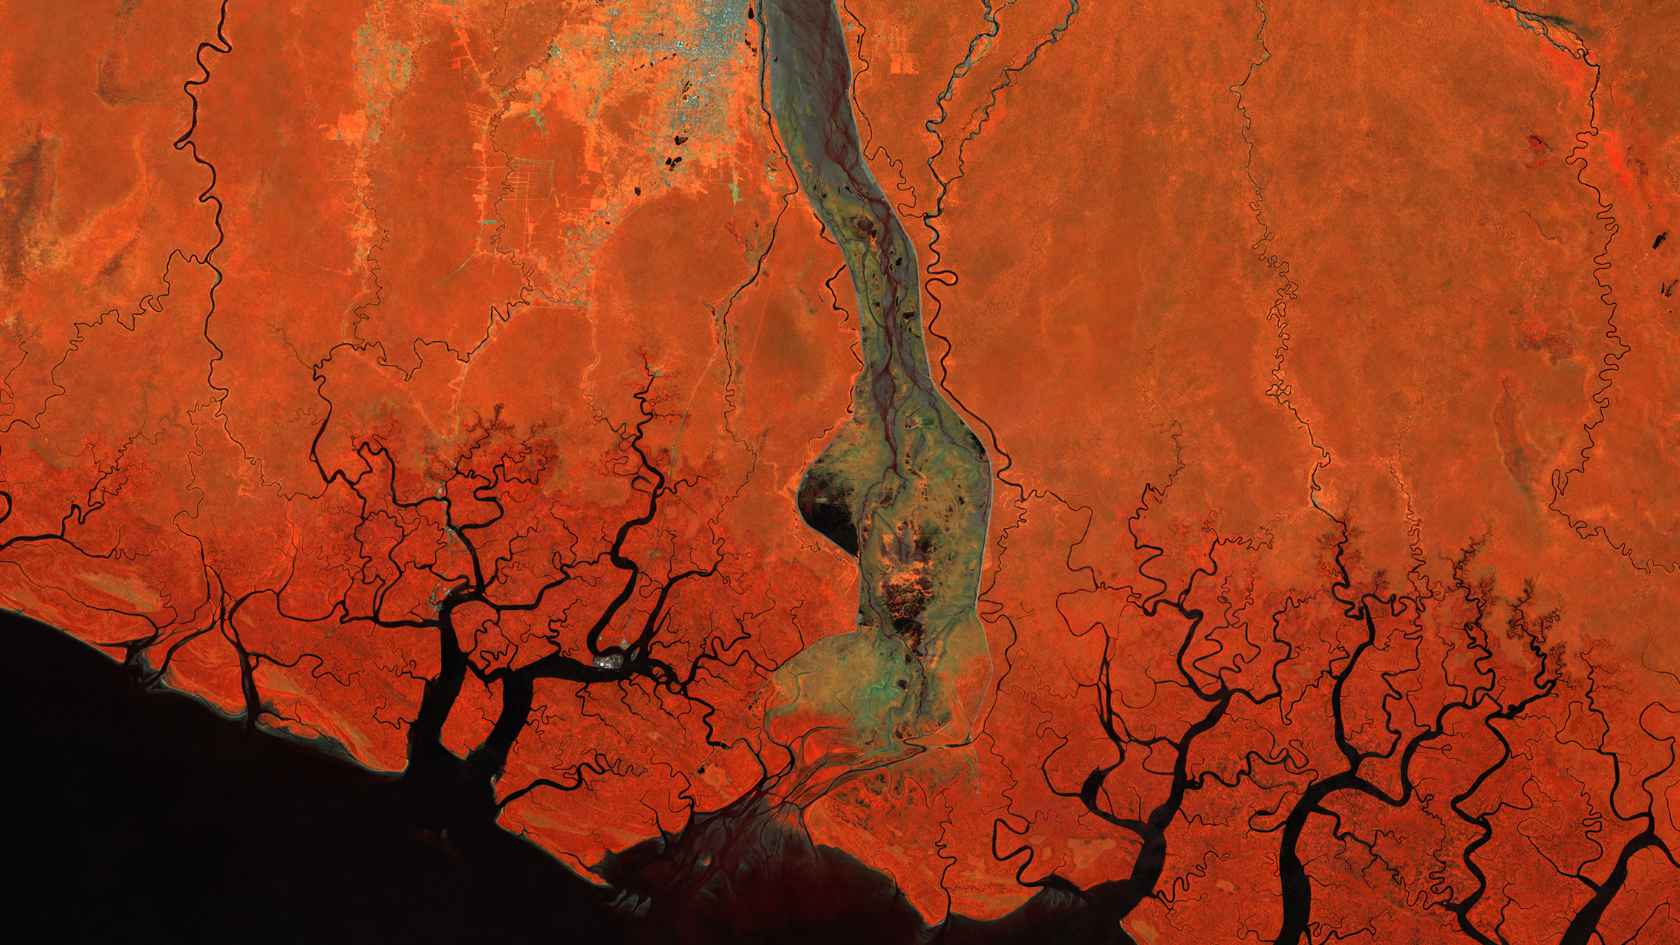
Infrared imagery, for example, is particularly useful for displaying the density and humidity of vegetation and identifying water surfaces. Plant leaves disperse the infrared rays to a greater extent than other surfaces. In the false-color image, this higher dispersion is depicted in orange. In the overburden deposits, most areas appear greenish-gray and display only a very faint tinge of orange. “This means the vegetation here is less dense and drier than in the area surrounding it,” says Damm-Reiser.
The false-color images also clearly show the watercourses. While bodies of water containing sediment are often impossible to distinguish from the sandy or gravelly riverbed in photos, they appear as clear black lines in the infrared image. This is because water absorbs all the radiation in this wavelength range. The images therefore help to provide a clearer picture of the state of the vegetation and the water system.
But this data on its own is not enough to enable us to understand the precise impact that the mine and its overburden are having on the ecosystem. “Biodiversity,” Damm-Reiser points out, “is very multidimensional and includes, for example, species diversity and genetic and functional diversity.” For instance, thermal measurements could add an extra dimension to the picture because they indirectly provide information about how much water the plants extract from the soil and release into the air via the transpiration process. This is because the environment is cooled down in the process. If the transpiration decreases because there are fewer plants, the environment gets warmer. “To understand the complex ecological processes, we normally have to combine different wave ranges and geodata.”
Contaminated groundwater
Damm-Reiser’s area of expertise is remote sensing of water systems. One particular challenge here is that many processes in these systems are not visible and can only be depicted indirectly. Here, too, models and visualizations help to make spatial and temporal relationships clear. In the DeltAs project involving geochemists from Eawag/ETH and hydrologists from the University of Neuchâtel, Damm-Reiser is investigating how the use of groundwater in the Red River and Mekong River deltas in Vietnam is changing. This is relevant because it means that more naturally occurring arsenic from the Himalayas is contaminating the groundwater and is thus having a negative effect on the supply of drinking water in the region.
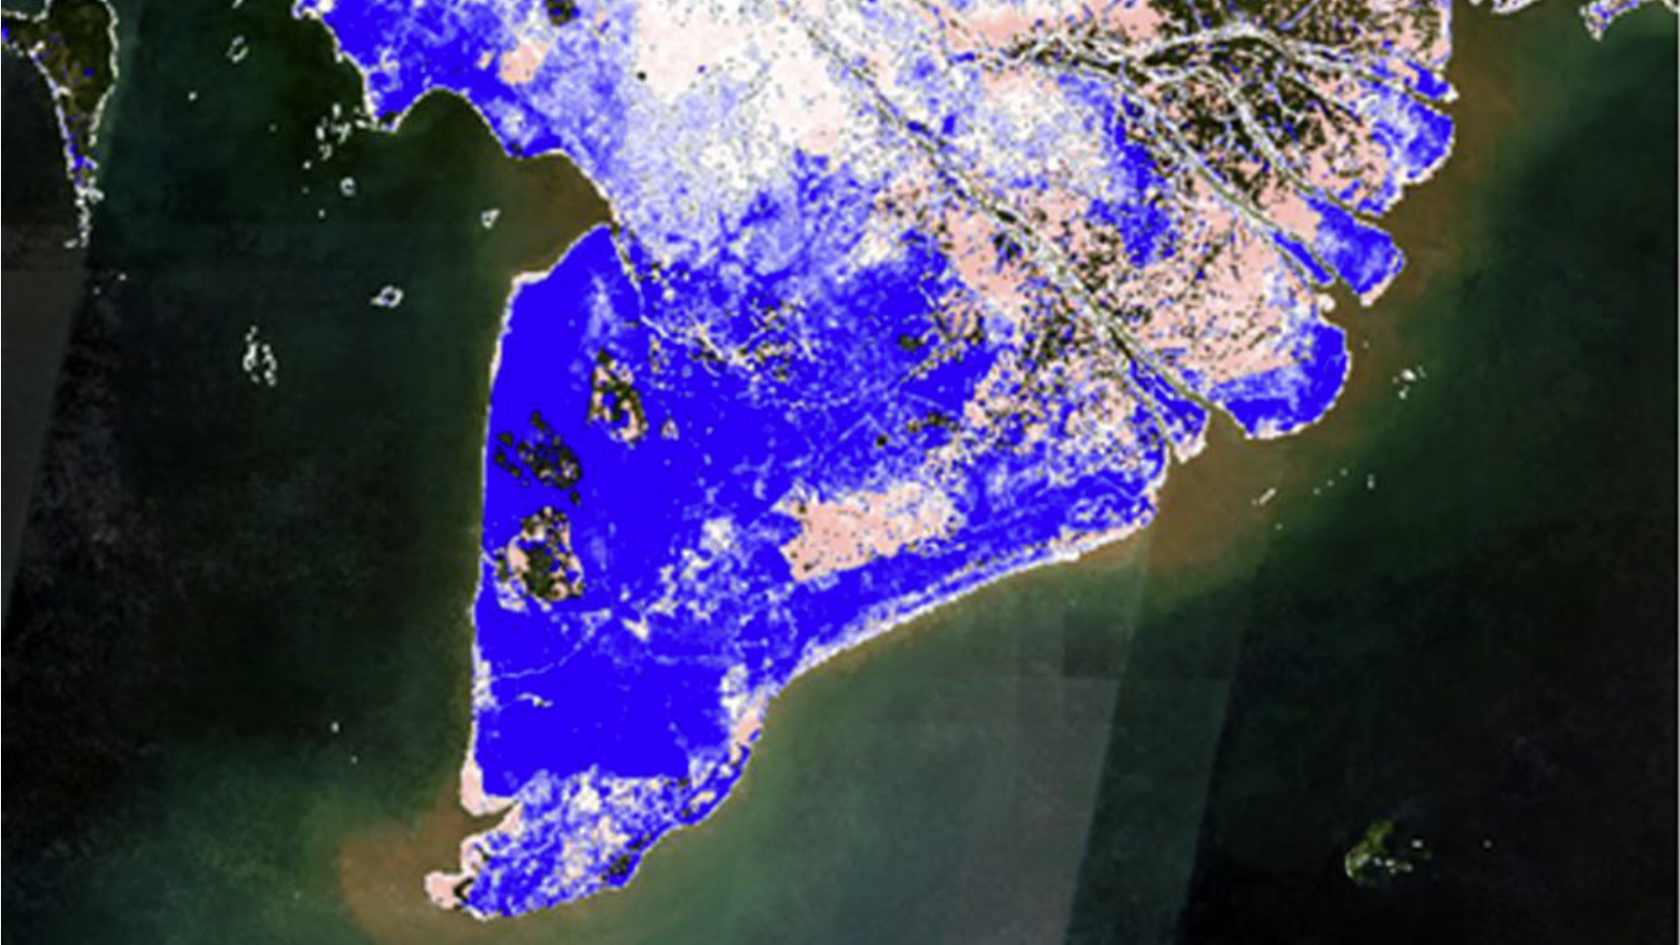
“You can’t measure groundwater contamination with remote sensing,” says Damm-Reiser, “but we can provide various data that the specialists can use to model processes.” This information can then be used to draw conclusions about possible contamination. Specifically, Damm-Reiser and his team evaluate various measurements from optical and radar satellites and use the results to create maps showing where there is water on the Earth’s surface. This is because water – a smooth surface – absorbs almost all incident solar radiation and, unlike other surfaces, does not scatter back radar beams.
Invisible processes
This visualization is also impressive: over the course of time, ever larger areas of the delta regions are depicted in blue on the map. The blue is also a false-color representation that illustrates the trend that’s less visible to the human eye: more and more areas are increasingly covered by water – probably because of the increasing level of rice cultivation in the region. The conclusion that can be drawn from this is that more and more groundwater is being pumped up to the surface in these areas.
Based on this data, hydrologists and geochemists can model the impact this is having on the groundwater flows. Depending on which geological layers the water flows through, it’s possible that toxic arsenic that is normally bound to iron will be released. This makes it a health hazard for the drinking water supply. The pictorial representation of how water is used on the surface shows where processes are taking place underground. This creates a better understanding of the processes that are not visible directly.
Interdisciplinary collaboration
Damm-Reiser, whose research group is based at UZH and Eawag, engages with specialists from other disciplines all the time, not just for the project in Vietnam. This is essential for understanding how the satellite data can be interpreted with regard to biological processes, for example: “When we’re looking at the droughts taking place in forests, we need to consult plant physiologists so we can understand how plants behave when they’re subject to water stress,” says Damm-Reiser.
If a plant doesn’t have enough water, then the stomata, the pores in the leaves, close up, which has an impact on photosynthesis. As the chlorophyll in the leaves emits a weak fluorescent light during photosynthesis, this activity can be measured optically. Damm-Reiser is currently involved in the development of the FLuorescence EXplorer (FLEX) satellite at the European Space Agency (ESA), which is intended to measure precisely this radiation. The knowledge gained from plant physiology helps to correlate the measurement data with the environmental stress that the plants suffer.
This interdisciplinary approach also applies to the Spatial Sustainable Finance project. “If we provide maps that show the risk of water pollution or biodiversity risks, then that’s one thing,” says Damm-Reiser, “but to assess the financial impact this will have for investors, we need to work with financial experts. This creates much greater added value.” But Damm-Reiser’s images make it clear even to laypeople that intensive use by human beings is leaving real traces in ecosystems – and they aren’t always visible as wounds or scars.